CPU & Memory Monitoring Software
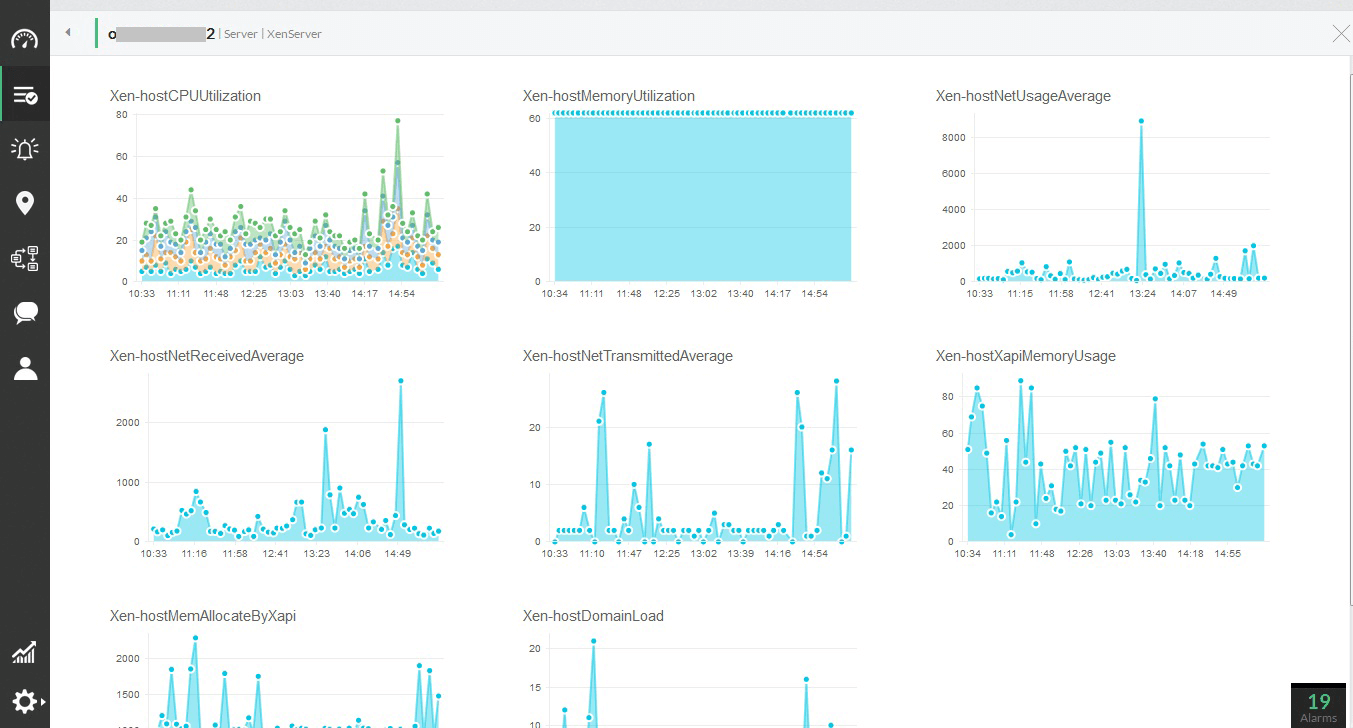
When you identify server performance degradation, the usual suspects are CPU, memory, and the disk. OpManager's hardware monitor scrutinizes these system resources on Windows and Unix-based servers and spots performance bottlenecks early on. OpManager uses SNMP, WMI, or SSH protocol to monitor the host resources and gathers performance data.
Using OpManager you can:
Start monitoring to manage CPU, Memory, and Disk utilization instantly
- Find CPU, Disk Space Monitor, and memory utilization monitors associated out-of-the-box for close to a dozen server types.
- Spot high resource utilization at a glance using the intuitive dials in snapshot page.
- Monitor multiple processors with detailed utilization reports for each CPU instance.
- Fine tune the monitoring configurations right from the snapshot page and narrow down a problem more quickly.
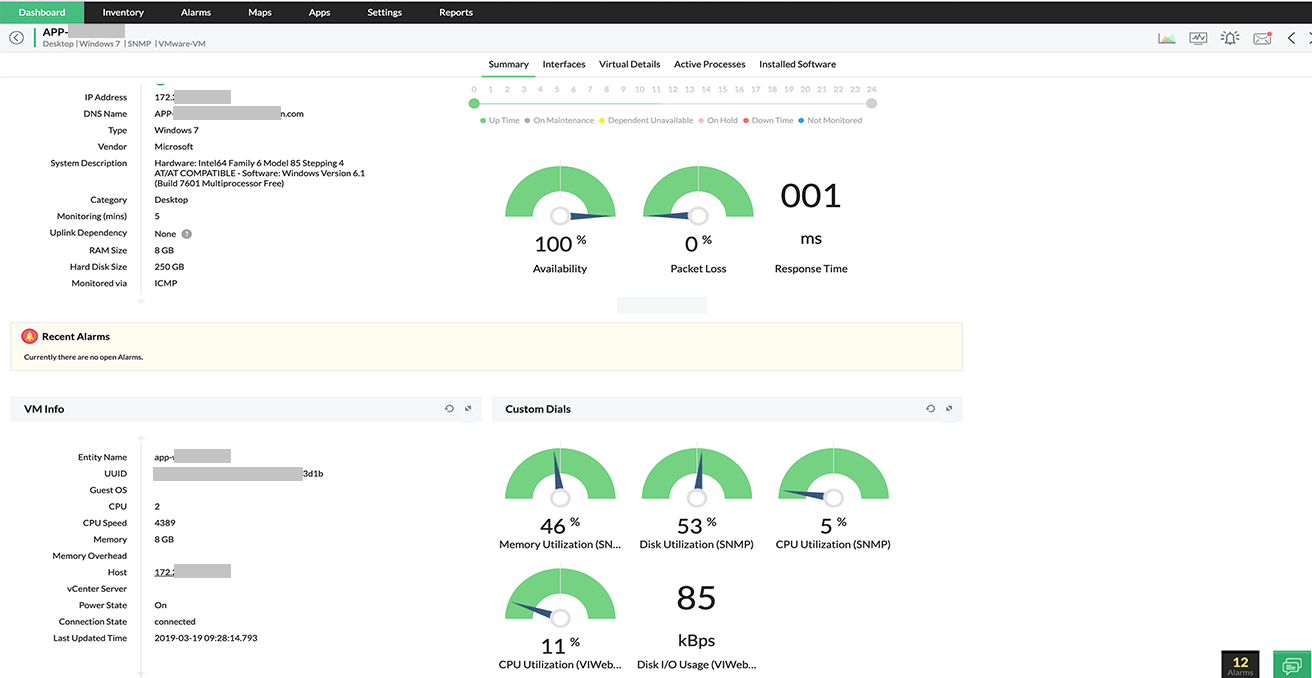
Monitor CPU Memory Disk with server resource performance dials.
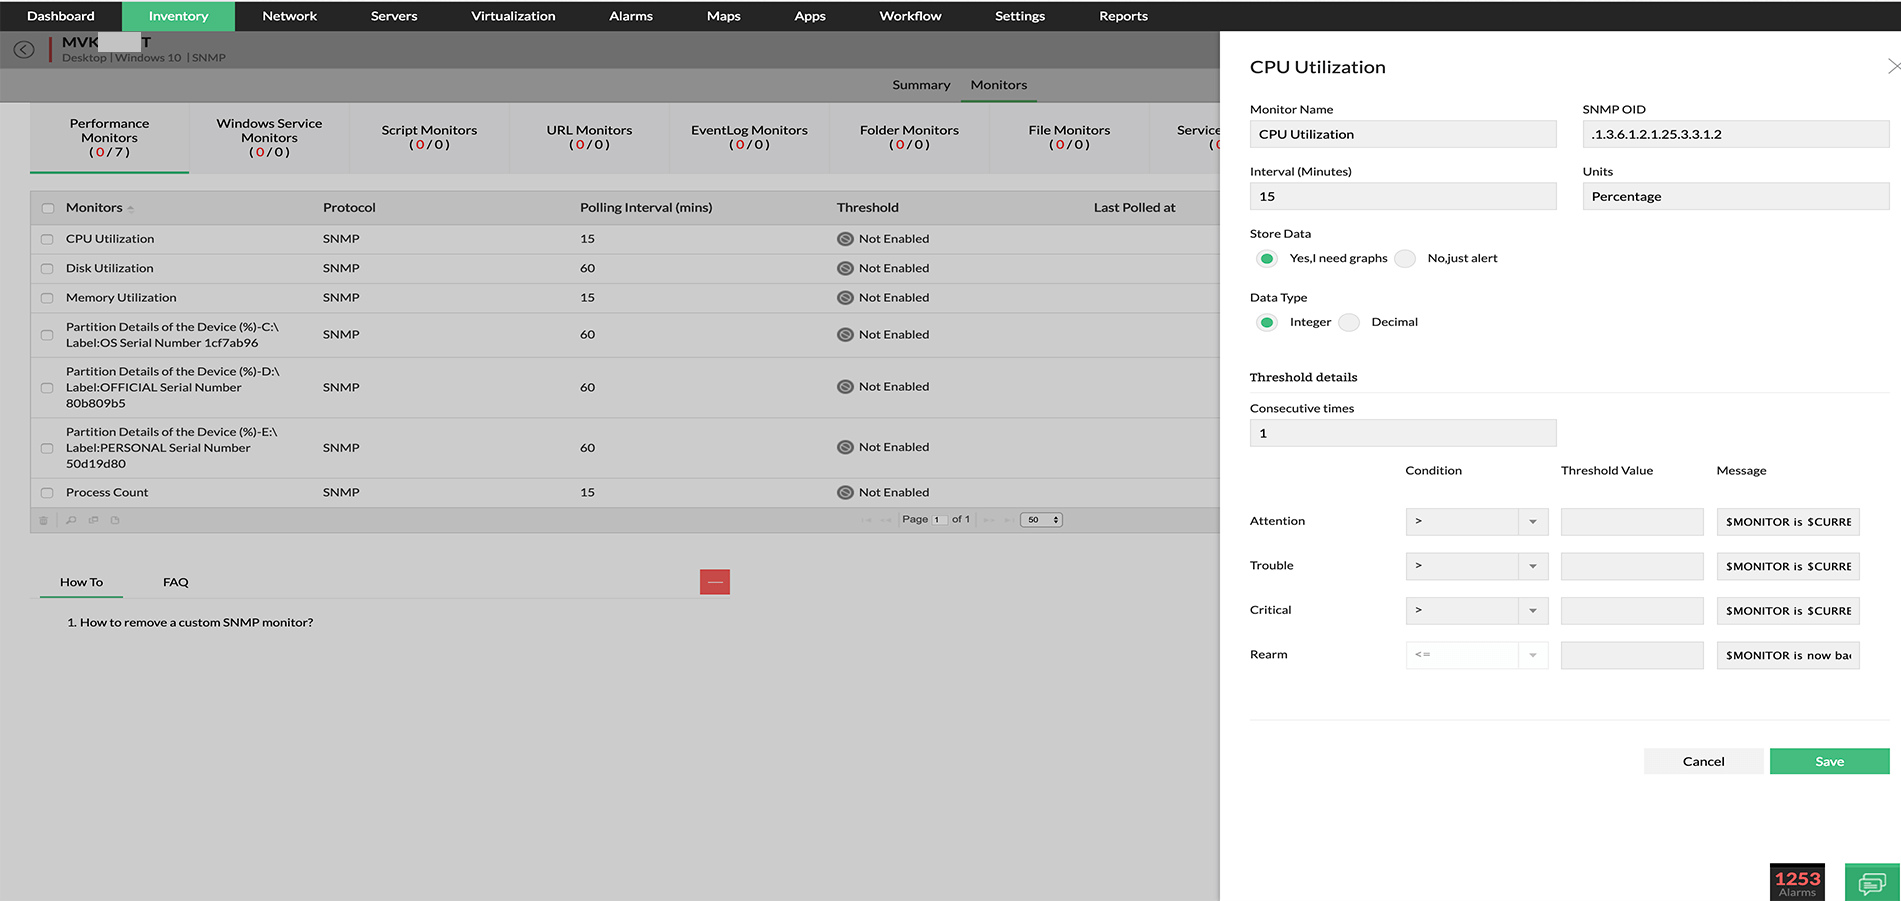
CPU monitor configuration screen. One can set a threshold and test the monitor to gauge the current performance statistics in a click.
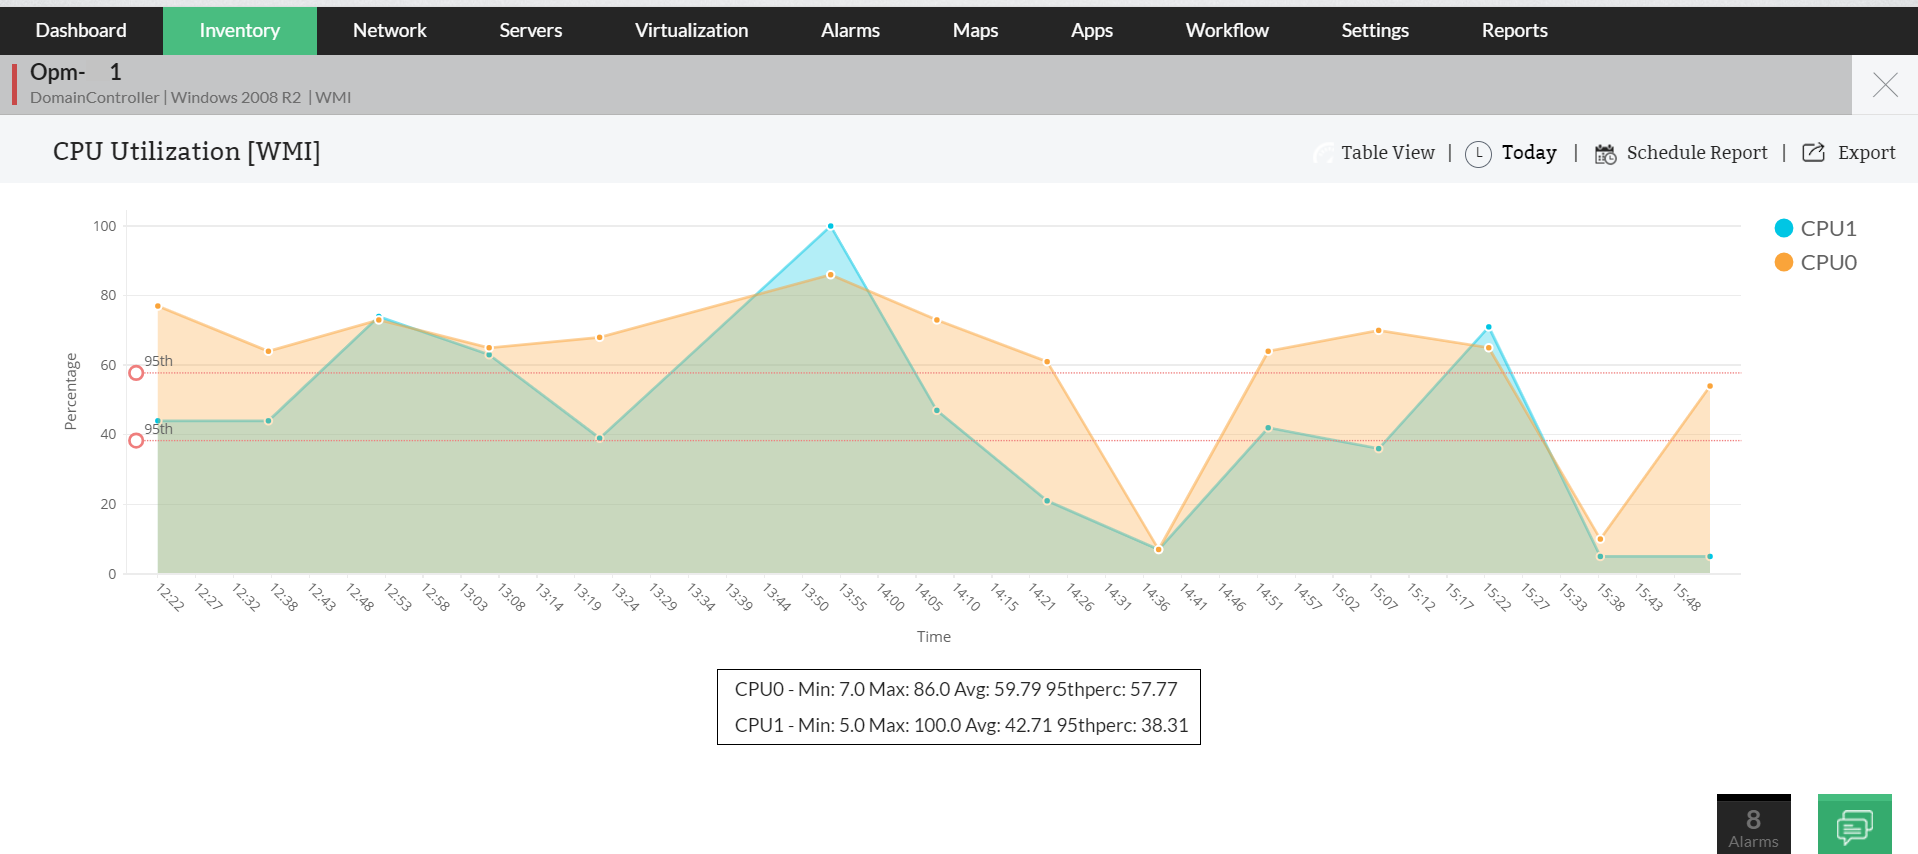
CPU monitor's utilization graph for a quad-core CPU.
PrevNext
Monitor over 25 different Memory, Disk, and CPU metrics across Servers
- Add more memory, disk or CPU monitors for other resource metrics based on the server need.
- Quickly find out what is causing application slowness despite normal resource utilization. The actual metric at fault could be the % processor time, the queue length, or a critical memory monitoring metric (maybe a fast eroding available physical memory) that is impacting the application performance!
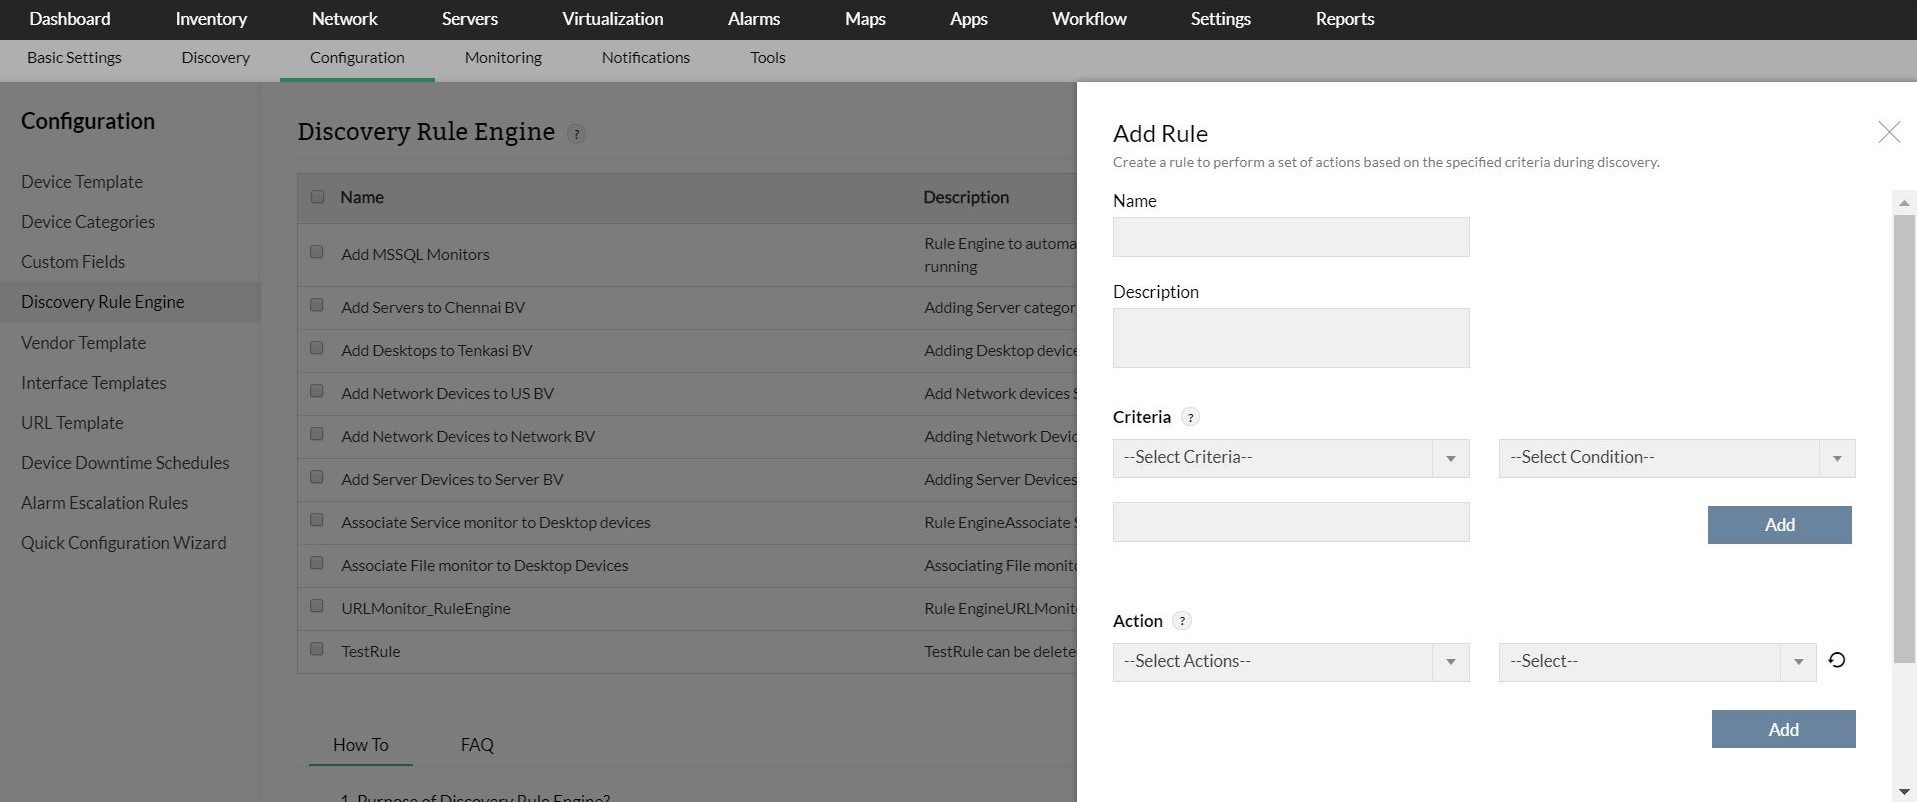
- Define more custom monitors (with options to apply expressions) for these resources using WMI scripts or CLI commands, or by simply querying the relevant SNMP variables.

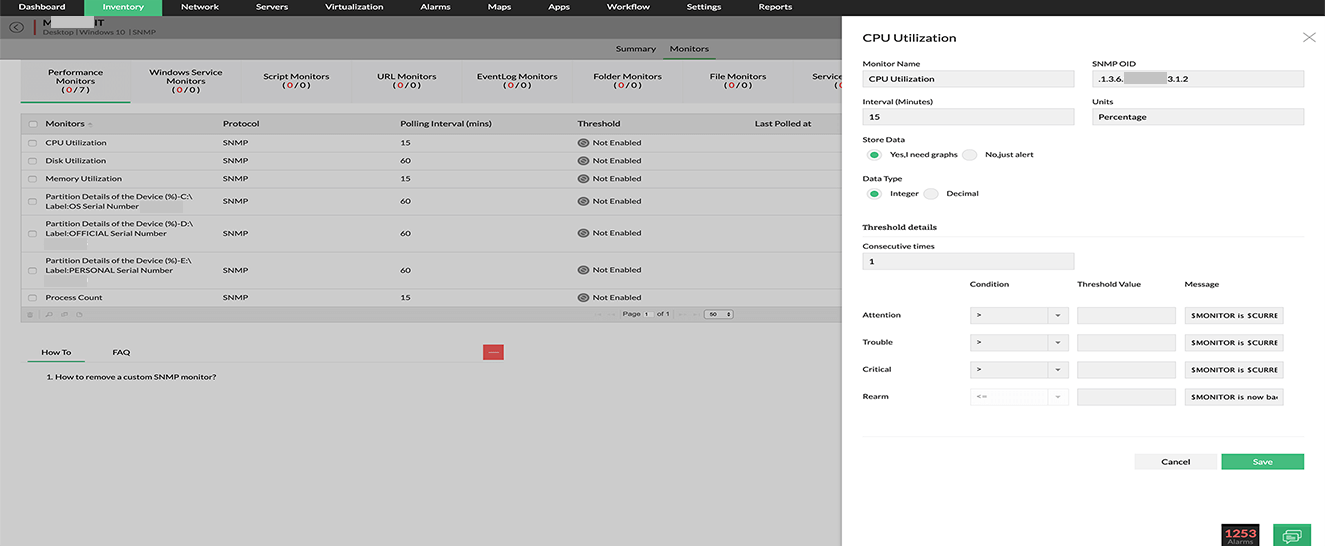
Screenshot showing creation of a custom SNMP monitor for CPU utilization.

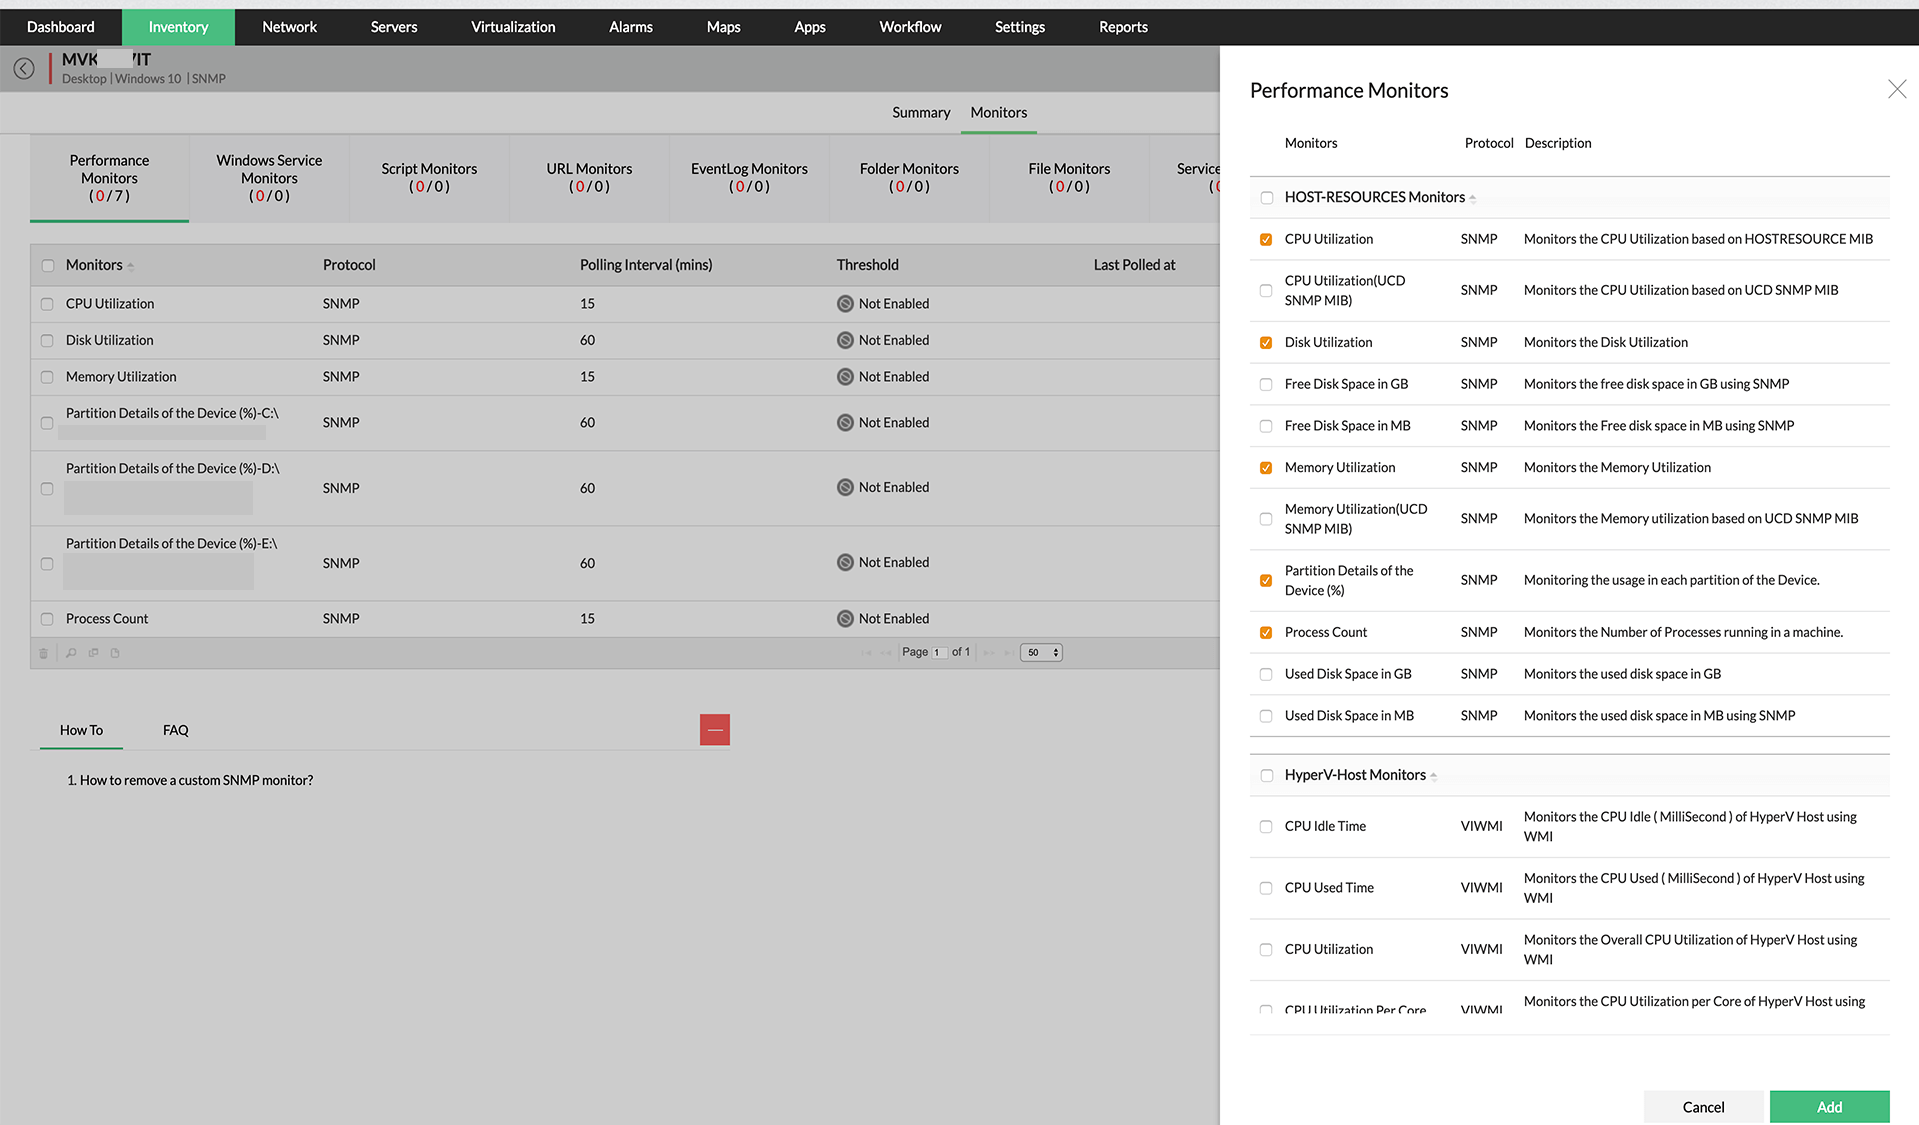
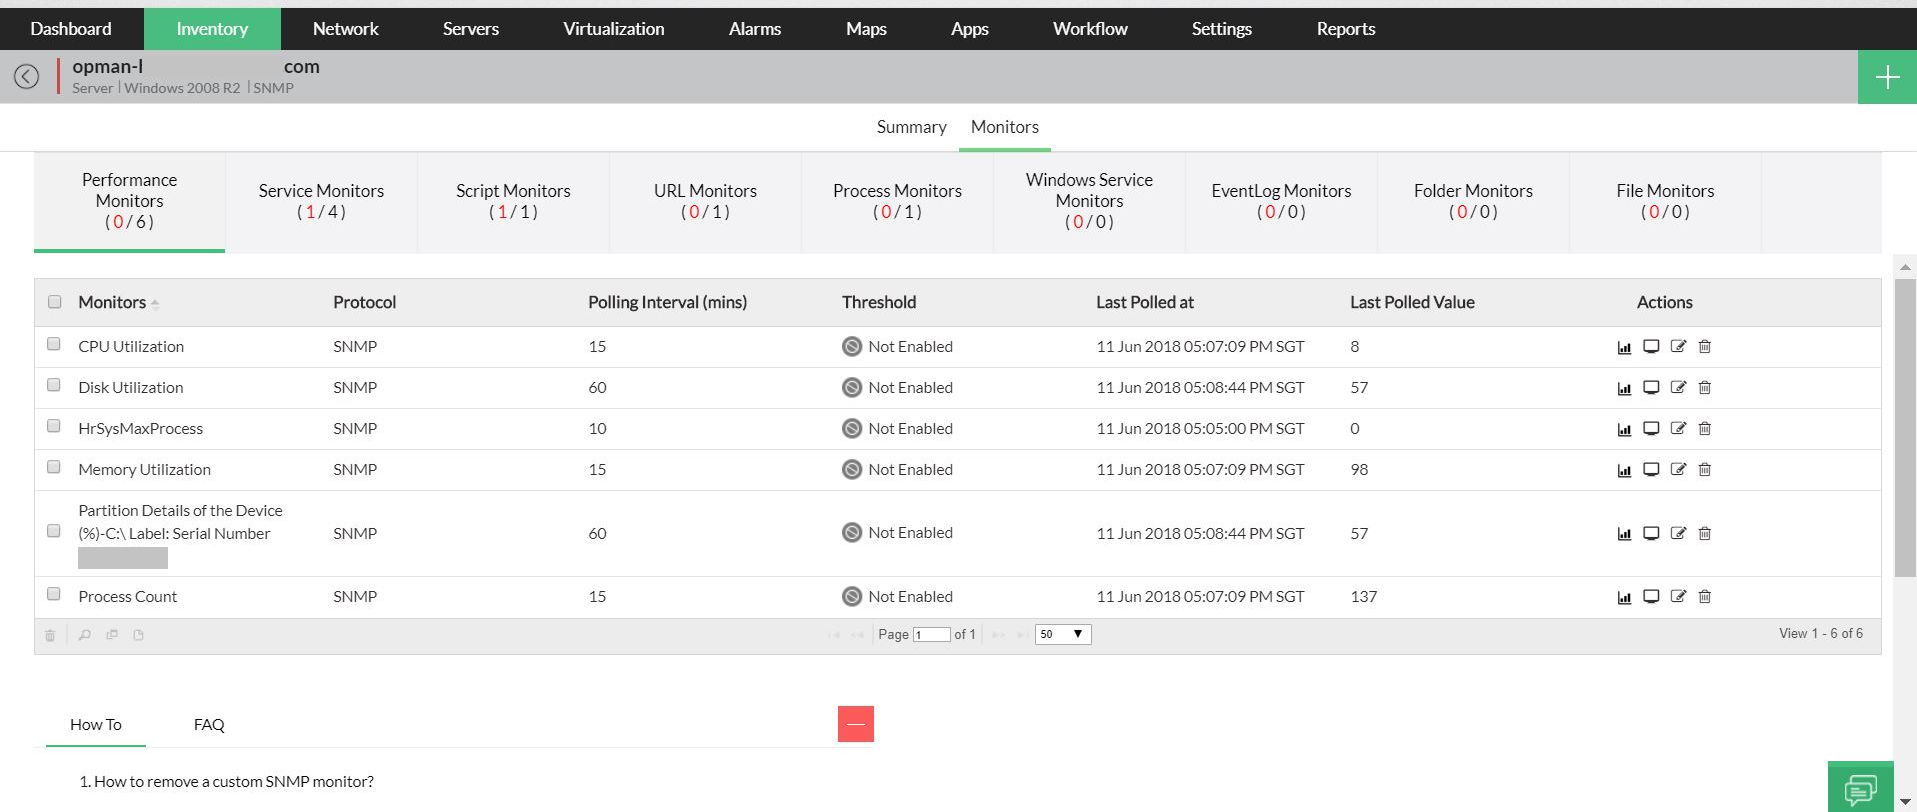
A collection of different host resource performance monitors from the server snapshot page.

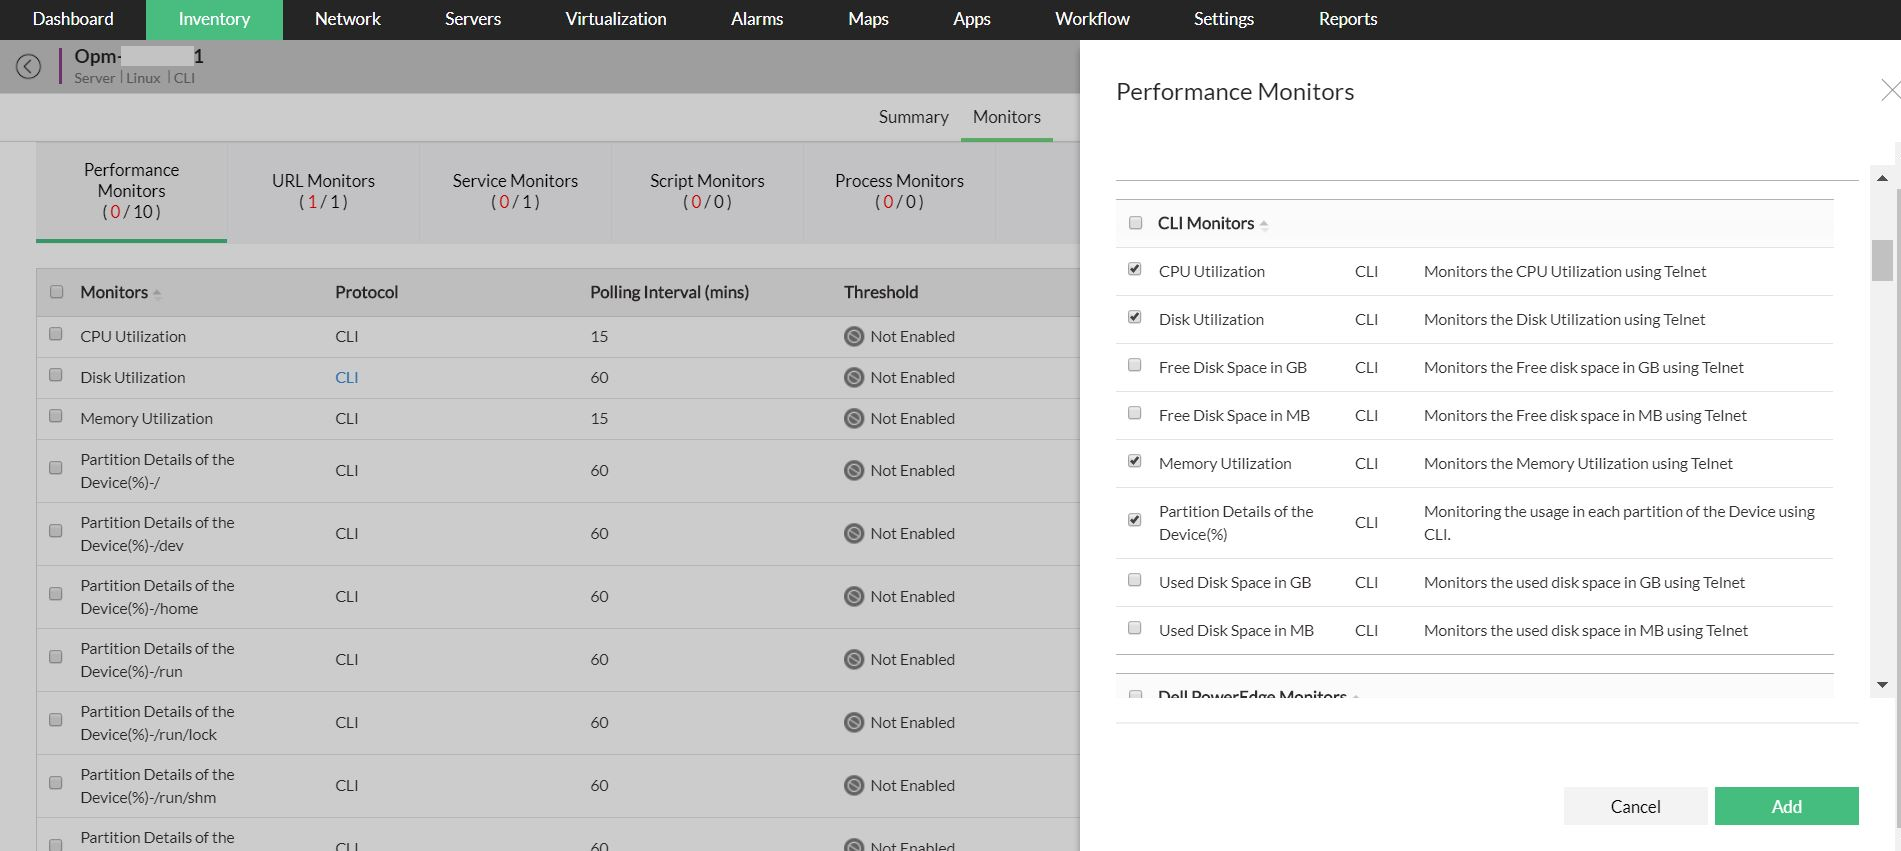
The list of Command Line Interface (CLI) server performance monitors for Linux or Unix-based devices.

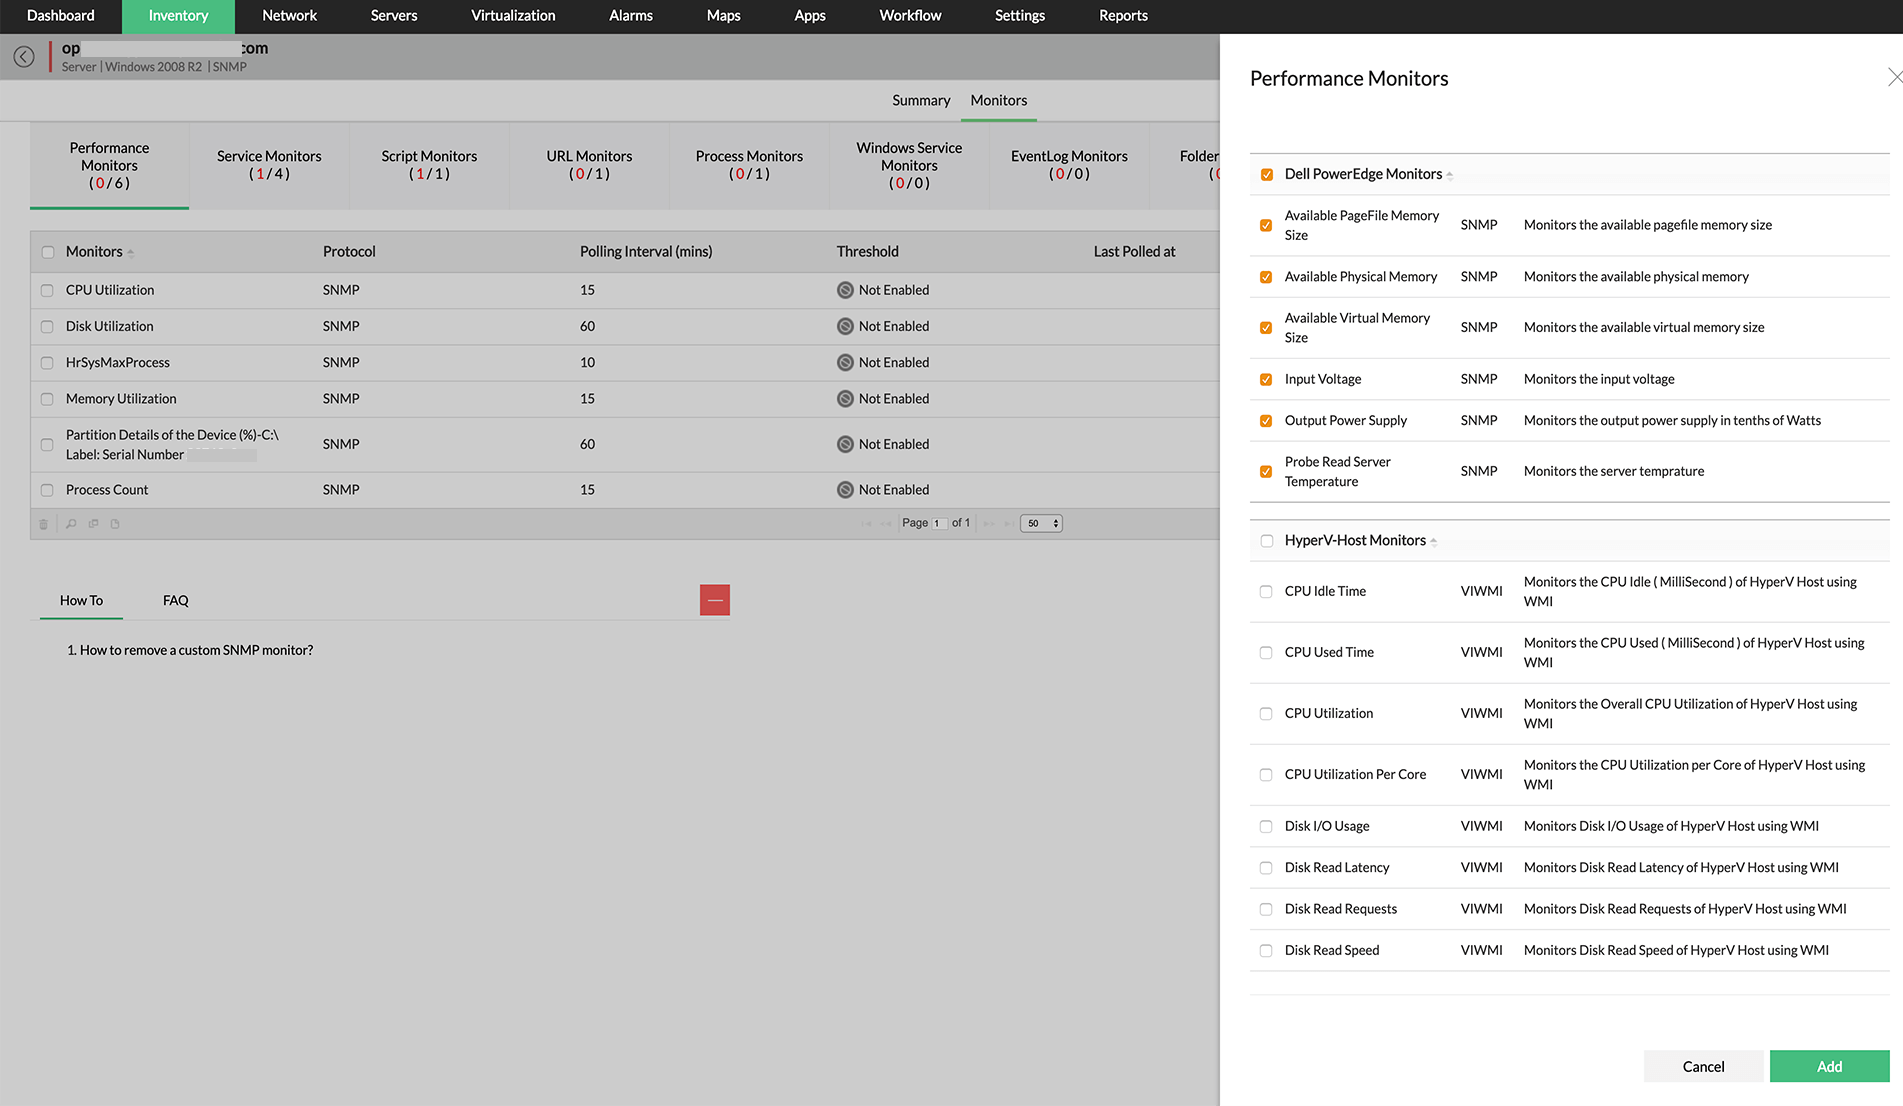
Vendor specific performance monitors to monitor disk space/usage and other disk performance metrics indepth.
PrevNext
Monitor all the following metrics and more:
| CPU Monitoring |
Memory Monitoring |
Disk Monitoring |
- CPU utilization
- CPU socket
- CPU speed
- CPU temperature monitor
- Idle Time
- Privileged time
- Processor Time
- User time
- Processor Queue
- Drive Size
- PSU Redundancy
|
- Free Physical Memory
- Page Faults
- Page Reads
- Page Writes
- Pages Per Second
- Available Page-File Memory Size
- Available Physical Memory
- Available Virtual Memory
|
- Disk utilization
- Disk Reads
- Disk writes
- Disk out-of-space Count
- Disk Partitions-wise monitors
- Disk Queue Length
- Free Disk Space in GB
- Free Disk Space ion MB
- Used Disk Space in GB
- Used Disk Space in MB
|
CPU Metrics
- CPU utilization
- CPU socket
- CPU speed
- Idle Time
- Privileged time
- Processor Time
- User time
- Processor Queue
- Drive Size
- PSU Redundancy
Memory Metrics
- Free Physical Memory
- Page Faults
- Page Reads
- Page Writes
- Pages Per Second
- Available Page-File Memory Size
- Available Physical Memory
- Available Virtual Memory
Disk Metrics
- Disk utilization
- Disk Reads
- Disk writes
- Disk out-of-space Count
- Disk Partitions-wise monitors
- Disk Queue Length
- Free Disk Space in GB
- Free Disk Space ion MB
- Used Disk Space in GB
- Used Disk Space in MB
Stay ahead of the problem with threshold based alerts for each resource monitor
- Specify thresholds and be notified when the processor time hits the limit, or when the disk space is being used up more than acceptable levels!
- Configure an increasing or decreasing threshold like in the case of available free memory or available disk space.
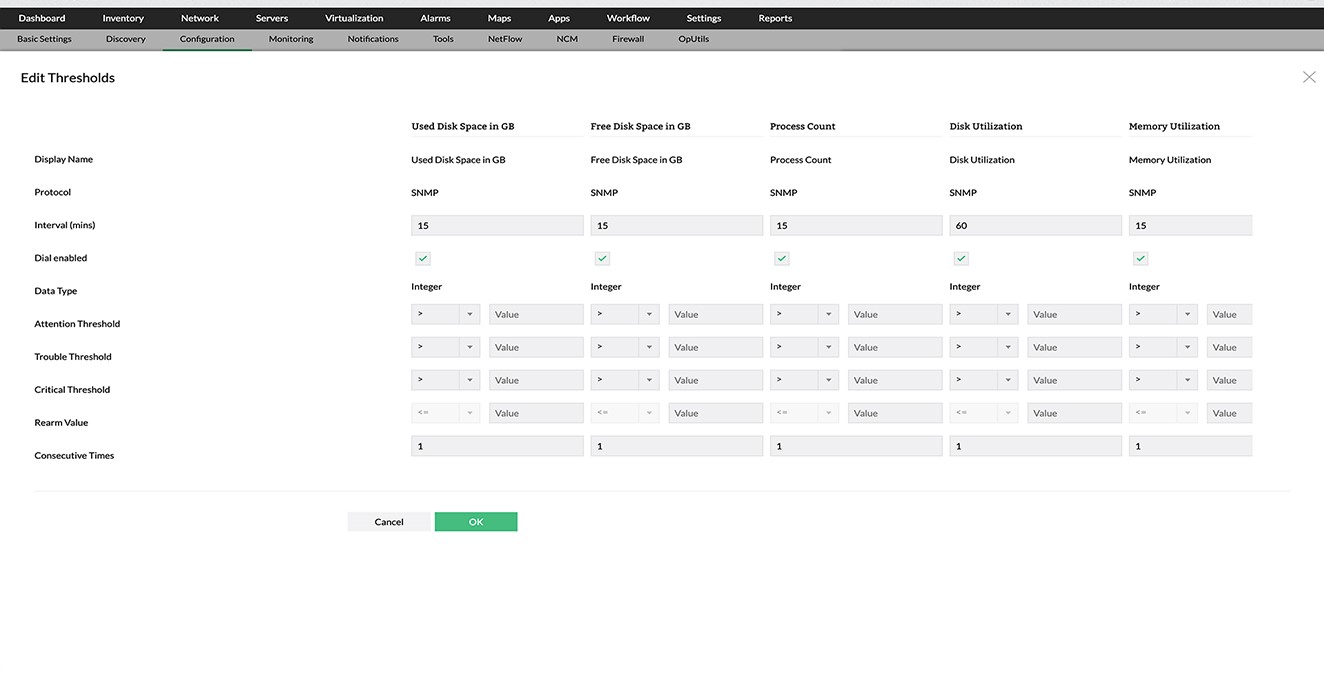
- Add more intelligence to threshold configuration by specifying the number of violations allowed before actually triggering an alert. Effect bulk threshold configuration too!
- Avert false alerts by specifying a re-arm value to clear an alert!

Edit thresholds for all the server performance monitors from a single screen.

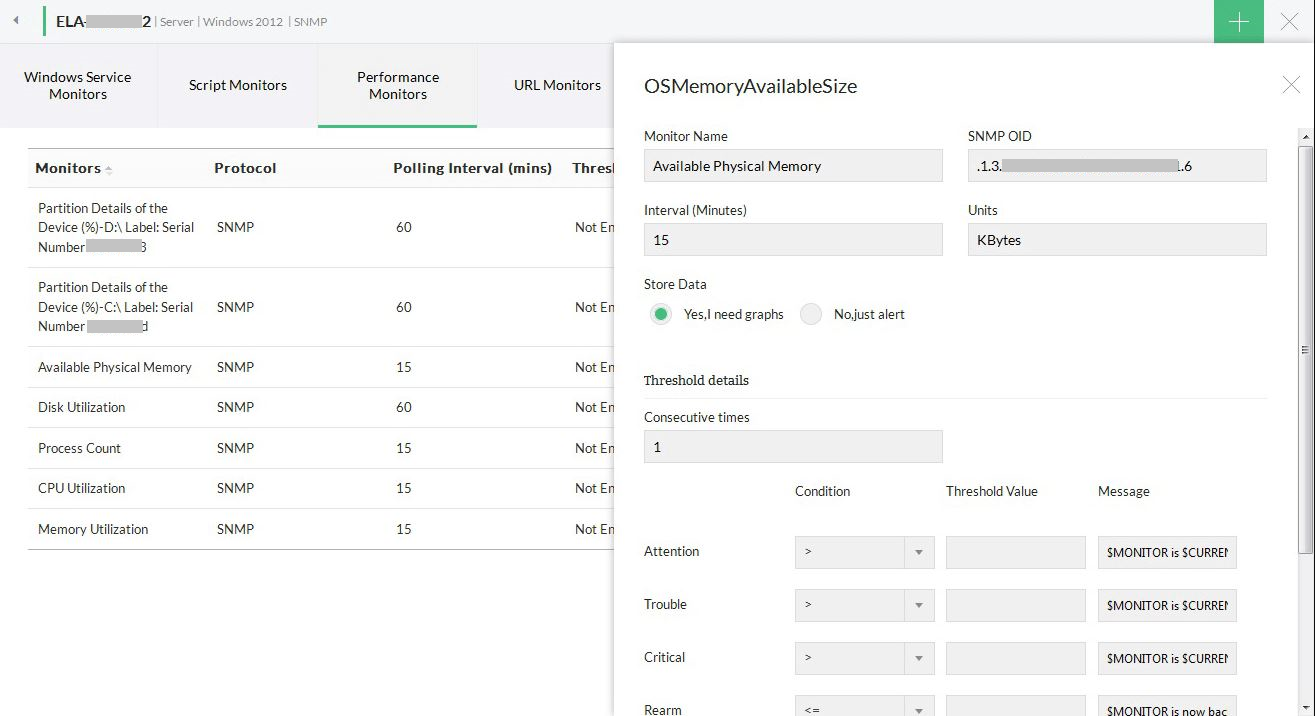
Editing the Available physical memory monitor, options to test the monitor, configure thresholds & other advanced performance management features.

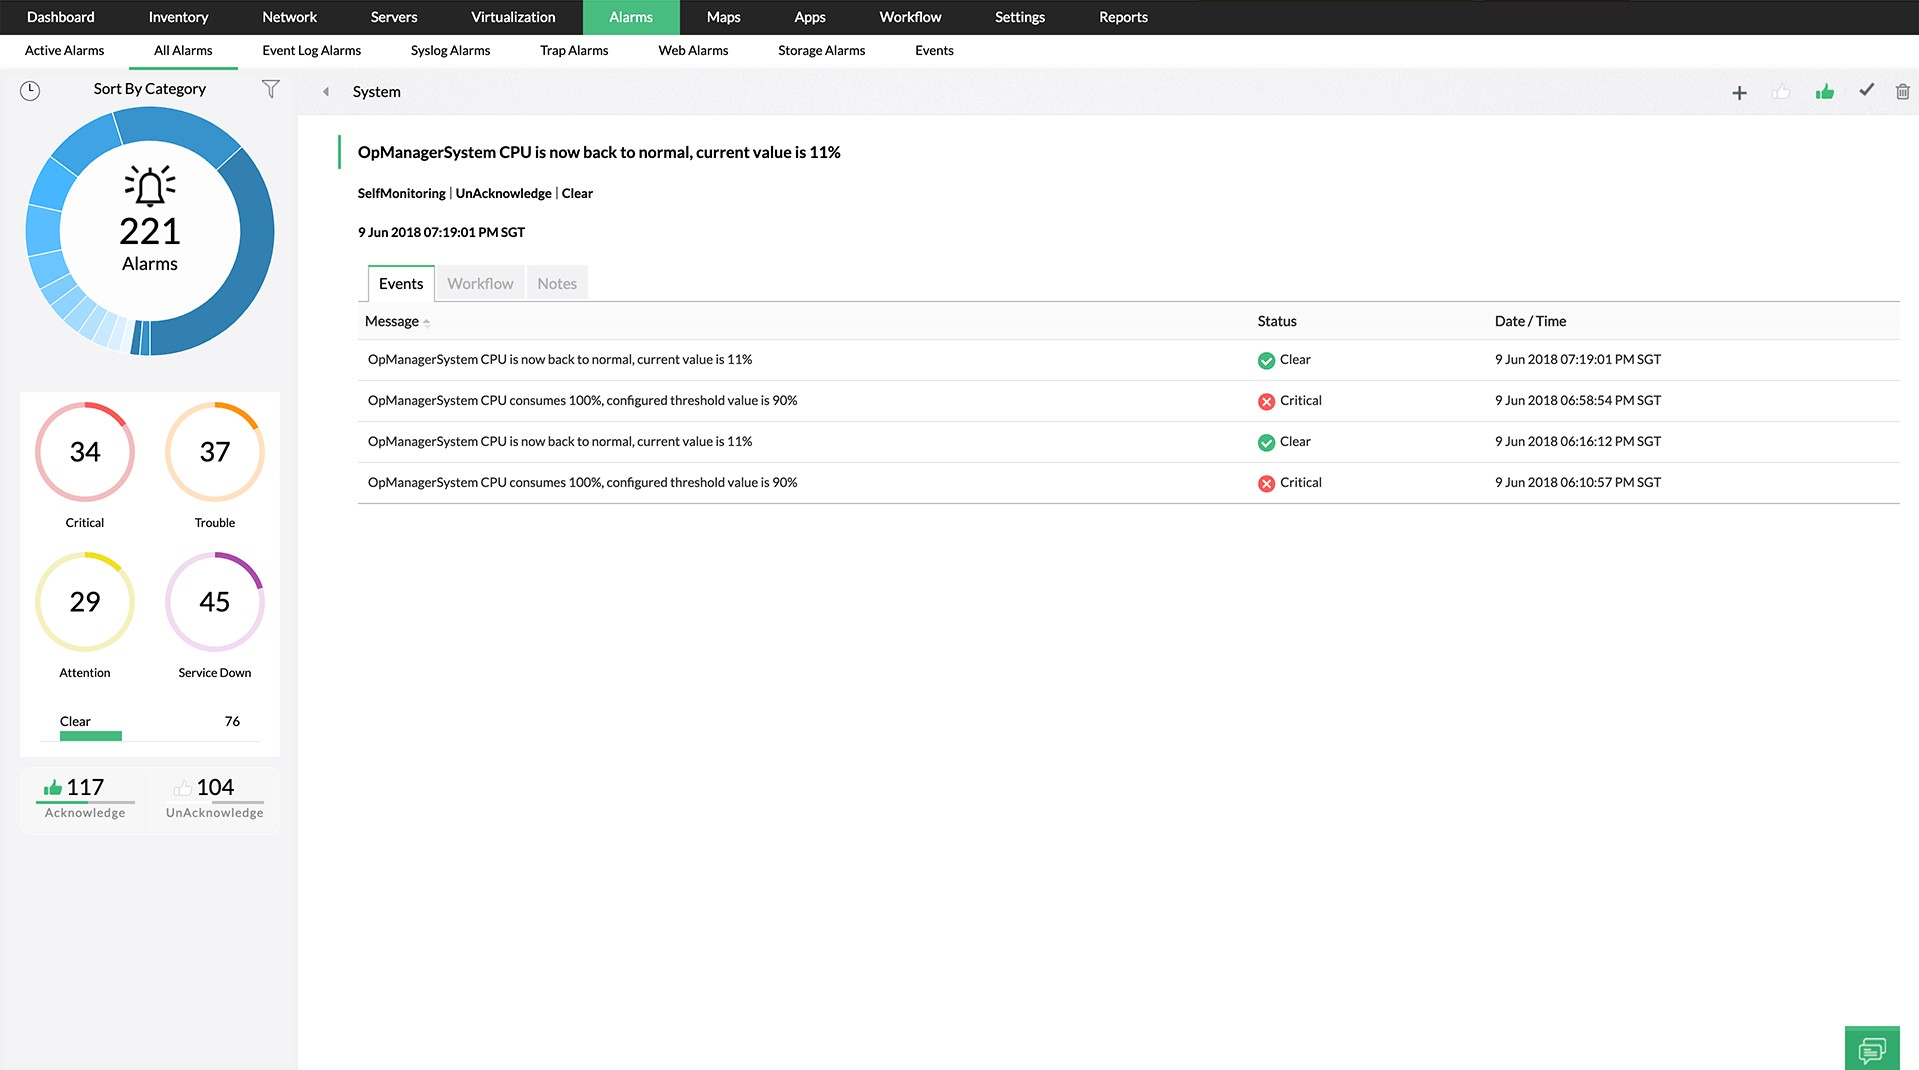
A memory threshold violated alarm, fault actions and event history details.
PrevNext
Troubleshoot and resolve resource faults quickly using diagnostic tools
- Troubleshoot instantly using process diagnostics to check the process-wise resource utilization and terminate an offending process if required.
- Quickly assess the performance by looking at the real-time utilization reports and decide on the course of action.
- Take a quick look at the process monitors on a server to check the CPU and memory used up by a process at one go.
- Configure system log monitoring rules and be notified of system events (Windows Event logs or Syslogs) for any of these resource failures. For instance, a system event for a RAID failure.

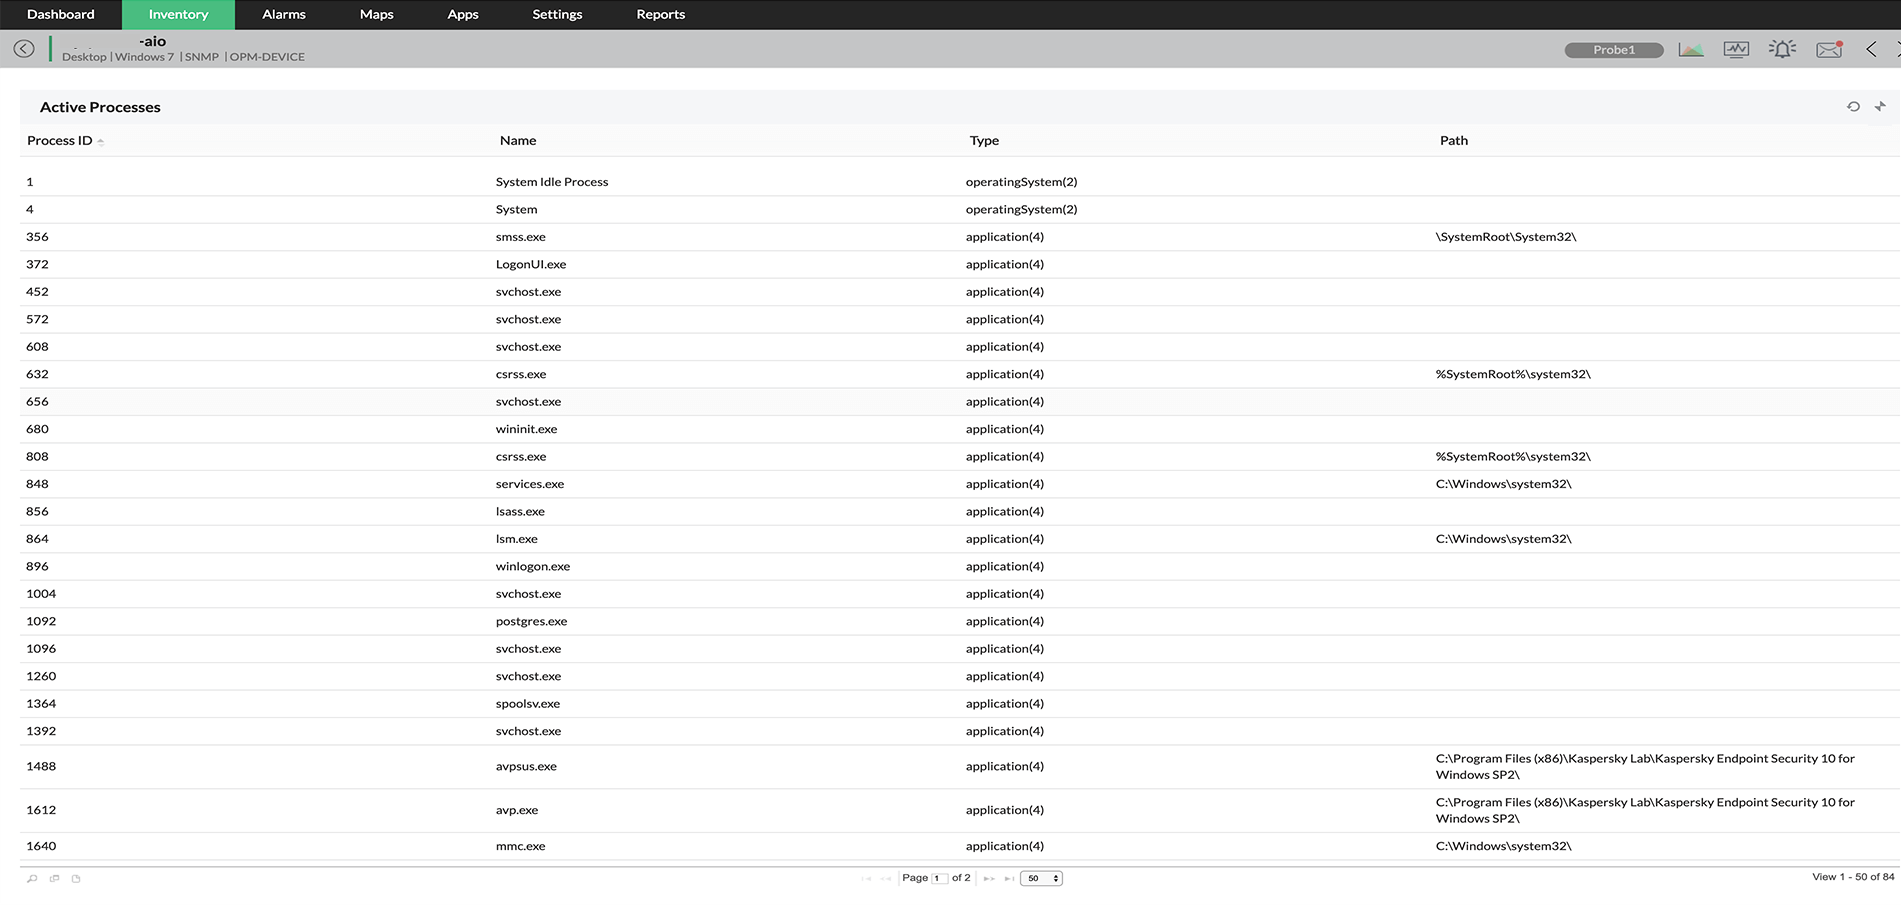
With real-time process monitoring, our CPU monitor and detailed memory monitoring will let you know how much CPU and memory is occupied by each critical process.

A handy tool to know the top 10 processes occupying CPU or Memory, with options to terminate a process remotely.

Adding a new Windows Event log rule for RAID events in a server.
PrevNext
Analyze CPU, Disk, Memory performance using the granular reports and act on the findings
- Drill down the reports from the dial graphs to see the detailed performance statistics for the required time window.
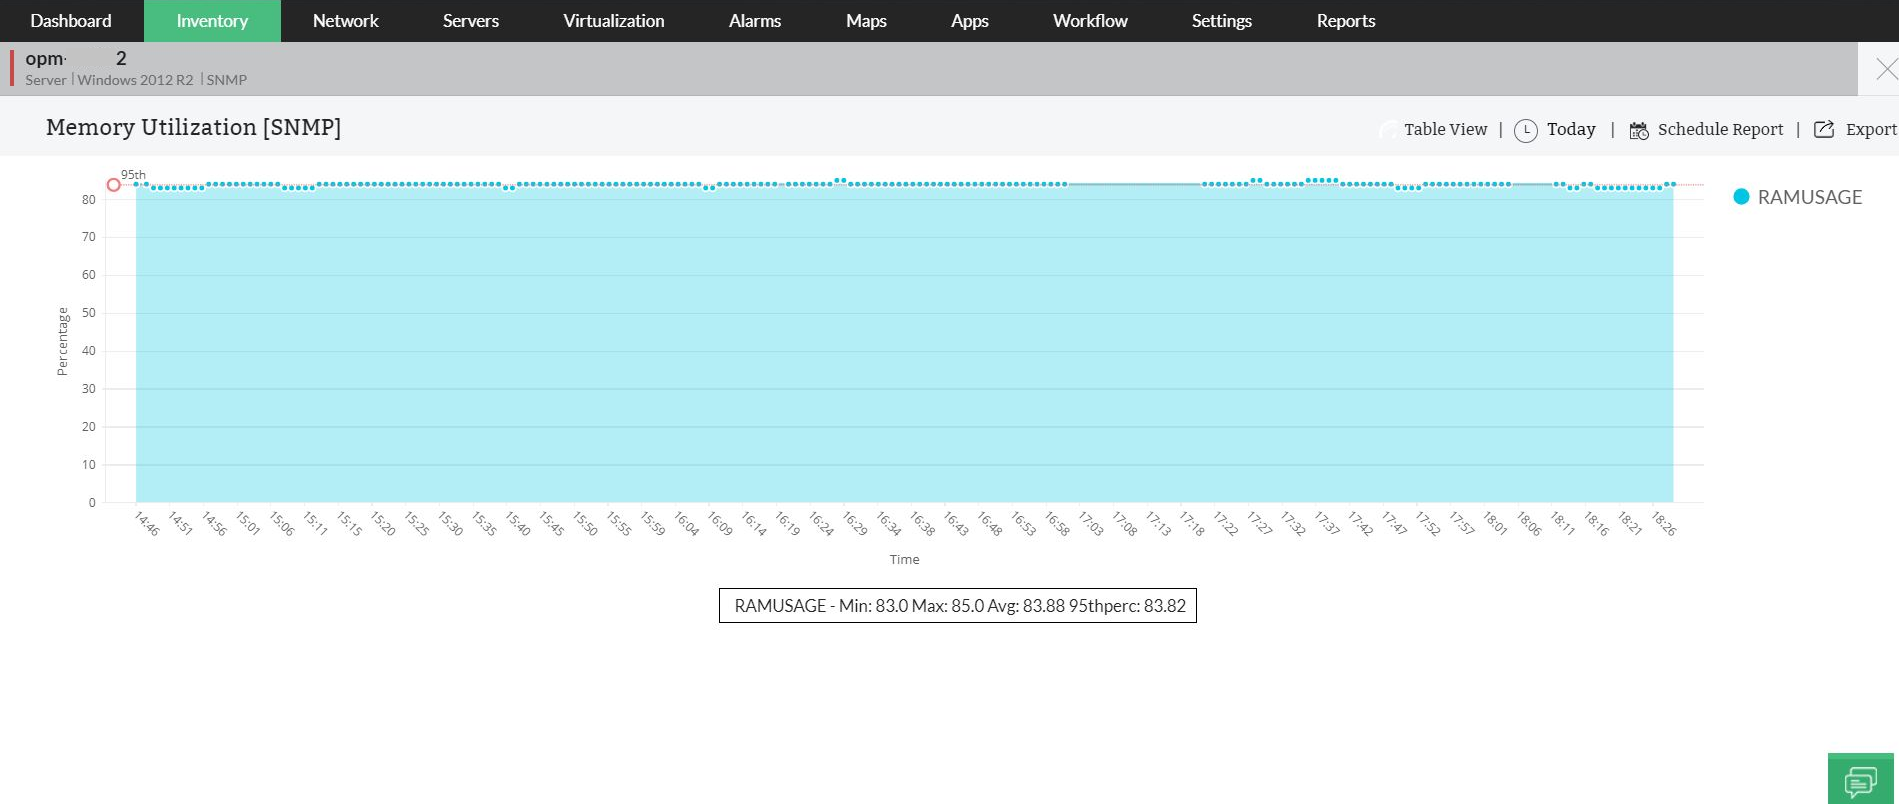
- Watch the 95th percentile reading on the reports and adjust the thresholds based on trend.
- Quickly pull out the performance reports for last 30 days or last 7 days and assess the need for a resource upgrade or analyze the trend.
- Assess the health of CPU, memory, disk utilization, and Process Count at the device level using the 'At-a-glance' report.
- At any given time, see the CPU, demory, and disk performance problems on top N servers using the Server Health report.

A graphical report on memory utilization and performance with 95th percentile, minimum, maximum and average performance stats.

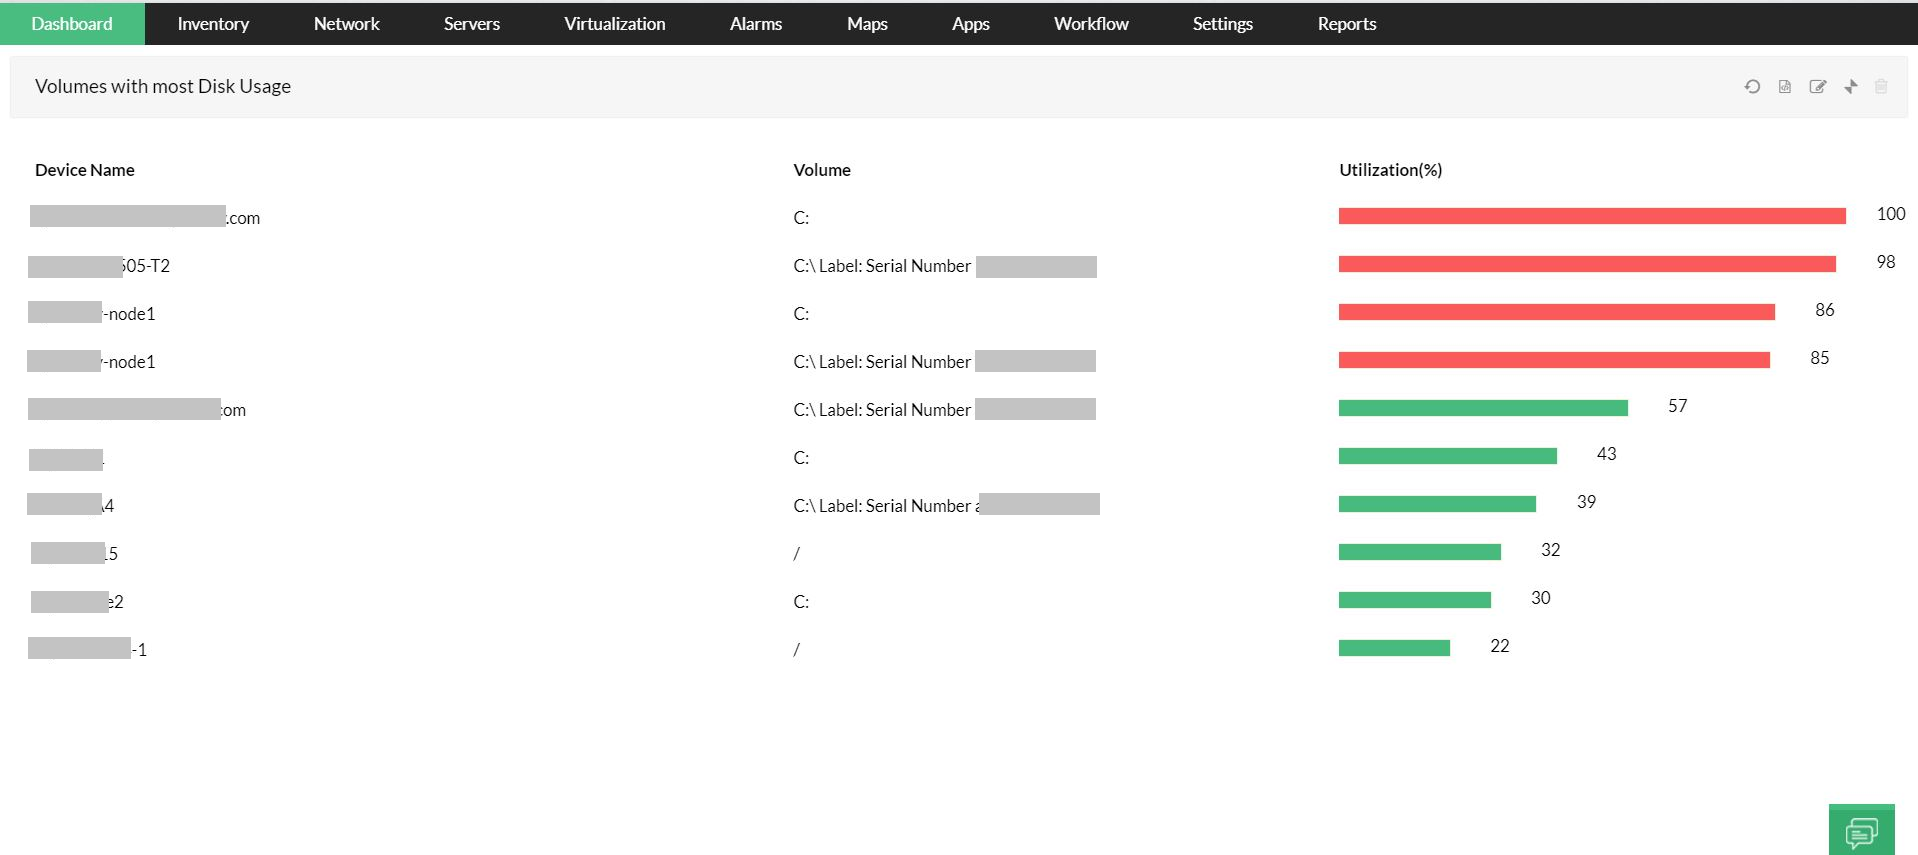
Report on volumes with high disk utilization, options to edit the report setting, Export the reports to different formats (PDF, XLS), Email or print.

A single report to know the performance of a particular server, includes server traffic information as well.
PrevNext
