What is not measured cannot be improved. CPU usage is one of the most important performance metrics in server monitoring. It's the primary value to analyze to determine the processing speed of applications, which is a key performance indicator of network and server health. If CPU usage spikes up, the user interface of that server will eventually slow down, and multiple process will crash along with the application running on that server, creating an avalanche effect. High CPU usage can also cause high memory utilization issues that can cause a server to go down for which CPU usage monitoring is important. Apart from this, monitoring based on hardware metrics such as CPU temperature monitoring will be an added advantage, as it gives more insights into the CPU's performance.
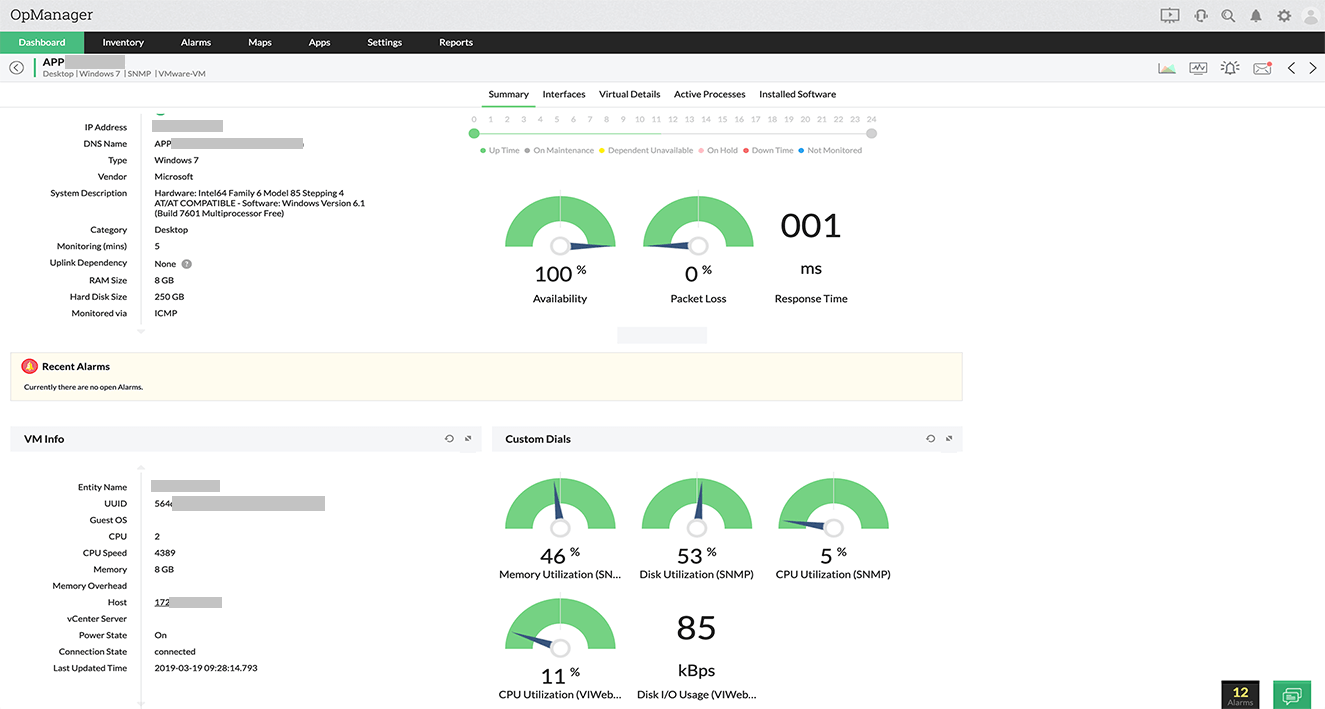
ManageEngine OpManager monitors servers, virtual machines (VMs), routers, switches, firewall, ports, wireless LAN controllers (WLCs), storage, and network devices via Windows Management Instrumentation (WMI), Simple Network Management Protocol (SNMP), and command line interface (CLI) protocols periodically. OpManager is a CPU usage monitoring software that enables CPU performance monitoring, CPU health check, CPU resource availability monitoring, CPU speed checks, and more. OpManager is both a Linux and Windows CPU usage monitor console.

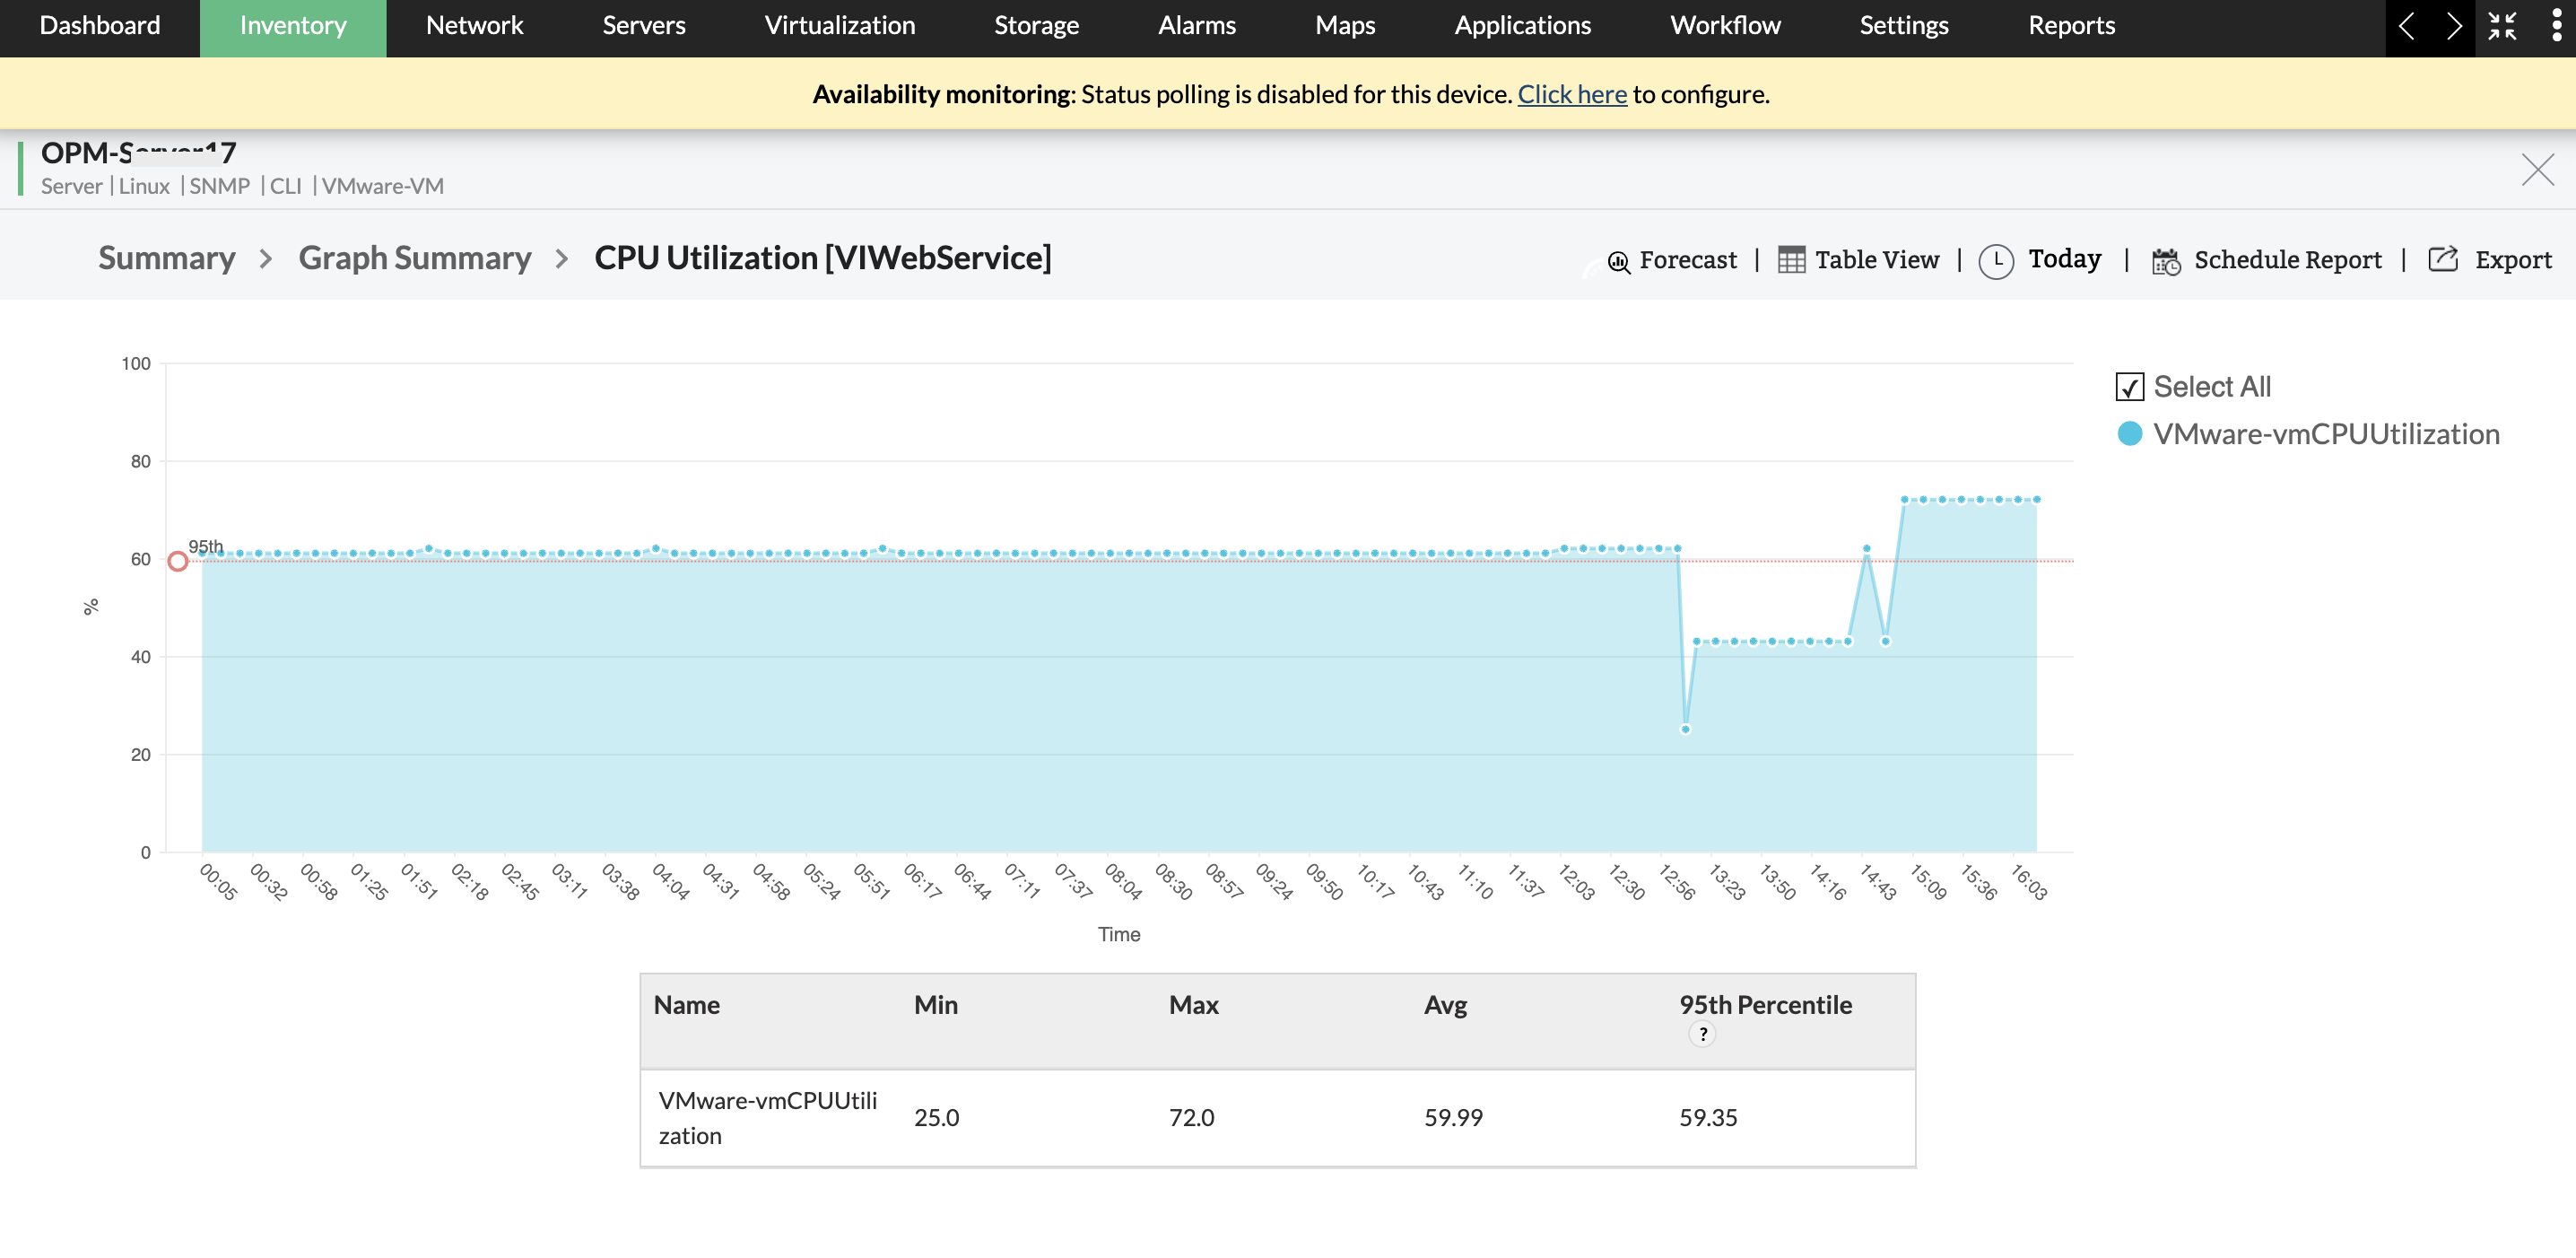
In an enterprise network, a typical office desktop might consume only 30 percent of the CPU usage. However, depending on the application's requirement , about 70 to 100 percent of the CPU is supposed to run CPU-exhausting activities on an average. Even then, most servers will run to 90 percent to 98 percent on average, where the CPU is considered to be fully used. If this happens occasionally, say for an adhoc application run or a team video conference call, it is understandable. However, when the CPU utilization spikes over 80 percent too often, the CPU tends to process the requests at a lower speed than desirable and drops requests, leading to a sluggish CPU performance. For network devices if the CPU utilization is high, packet drop is inevitable. This is where CPU load monitoring comes into play.
For large and enterprise networks, it is almost impossible to know which server would have high CPU utilization issues, and would require manual actions by technicians or IT admins. But these problems can directly hamper business continuity for an uncertain amount of time, which could potentially cost an organization millions of dollars. In a virtual environment, it's not easy to ascertain which device is using high CPU resource without the user informing the IT admin. If the CPU spike goes unnoticed, then the server can go down for no apparent reason, causing a disruption in operations. This is why every IT needs a CPU load monitor. With a CPU usage monitoring tool like OpManager in place, it's not necessary for the user to keep an eye on CPU usage. OpManager accomplishes this by tracking CPU usage and potential CPU bottlenecks, enabling IT admins to improve network performance.

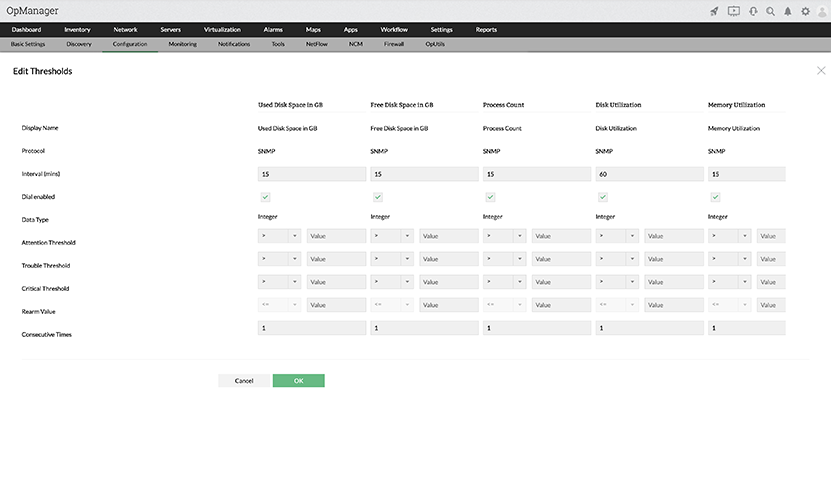
OpManager's CPU usage monitor enables IT admins to set thresholds for each CPU monitor so they can be informed of the CPU usage limit when the processor time reaches the limit, or when the utilization of the disk exceeds the specified limit. The thresholds can be set according to the number of breaches or severity levels such as attention/ trouble/critical. These alerts can be sent via various notification profiles such as SMS, email, Slack, etc.

OpManager provides over 100 built-in reports. Using the reports feature,, a report can be manually generated or scheduled to be auto-generated in a designated time, based on any parameter for measuring CPU usage.
OpManager's reports can be organized to show interfaces or devices with the highest CPU utilization, CPU efficiency, and interface errors for a particular time frame. It is possible to drill down into these metrics to learn more from the reports. Reports can be saved as PDF, HTML or sent via email.
| Metrics | Description monitored |
| CPU utilization | Monitors the CPU utilization of the network device |
| CPU socket | Monitors the physical socket number of the CPU chip |
| CPU speed | Monitors the internal speed in megahertz of this processor |
| Idle Time | Monitors the percentage of time during the sample interval that the processor was idle |
| Privileged Time | Percentage of non-idle processor time spent in privileged mode |
| Processor Time | Monitors the CPU usage of a selected, individual process |
| User Time | Percentage of non-idle processor time spent in user mode |
| Processor Queue | Displays the number of process threads (program execution units) waiting to be run on all processors |
| Drive Size | Monitors the physical drive size in megabytes (MBs) |
| PSU Redundancy | Monitors the redundancy state of the power supply |
| Page faults | Overall rate at which faulted pages are handled by the processor |
| CPU process count | Monitors the number of processes running |
Monitoring CPU usage is one among the many functionalities OpManger has up its sleeves when it comes to CPU monitoring. OpManager's comprehensive CPU monitoring funtionalities encompass tracking CPU performance, monitoring CPU hardware metrics, holistic dashboards dedicated to CPU monitoring and much more.